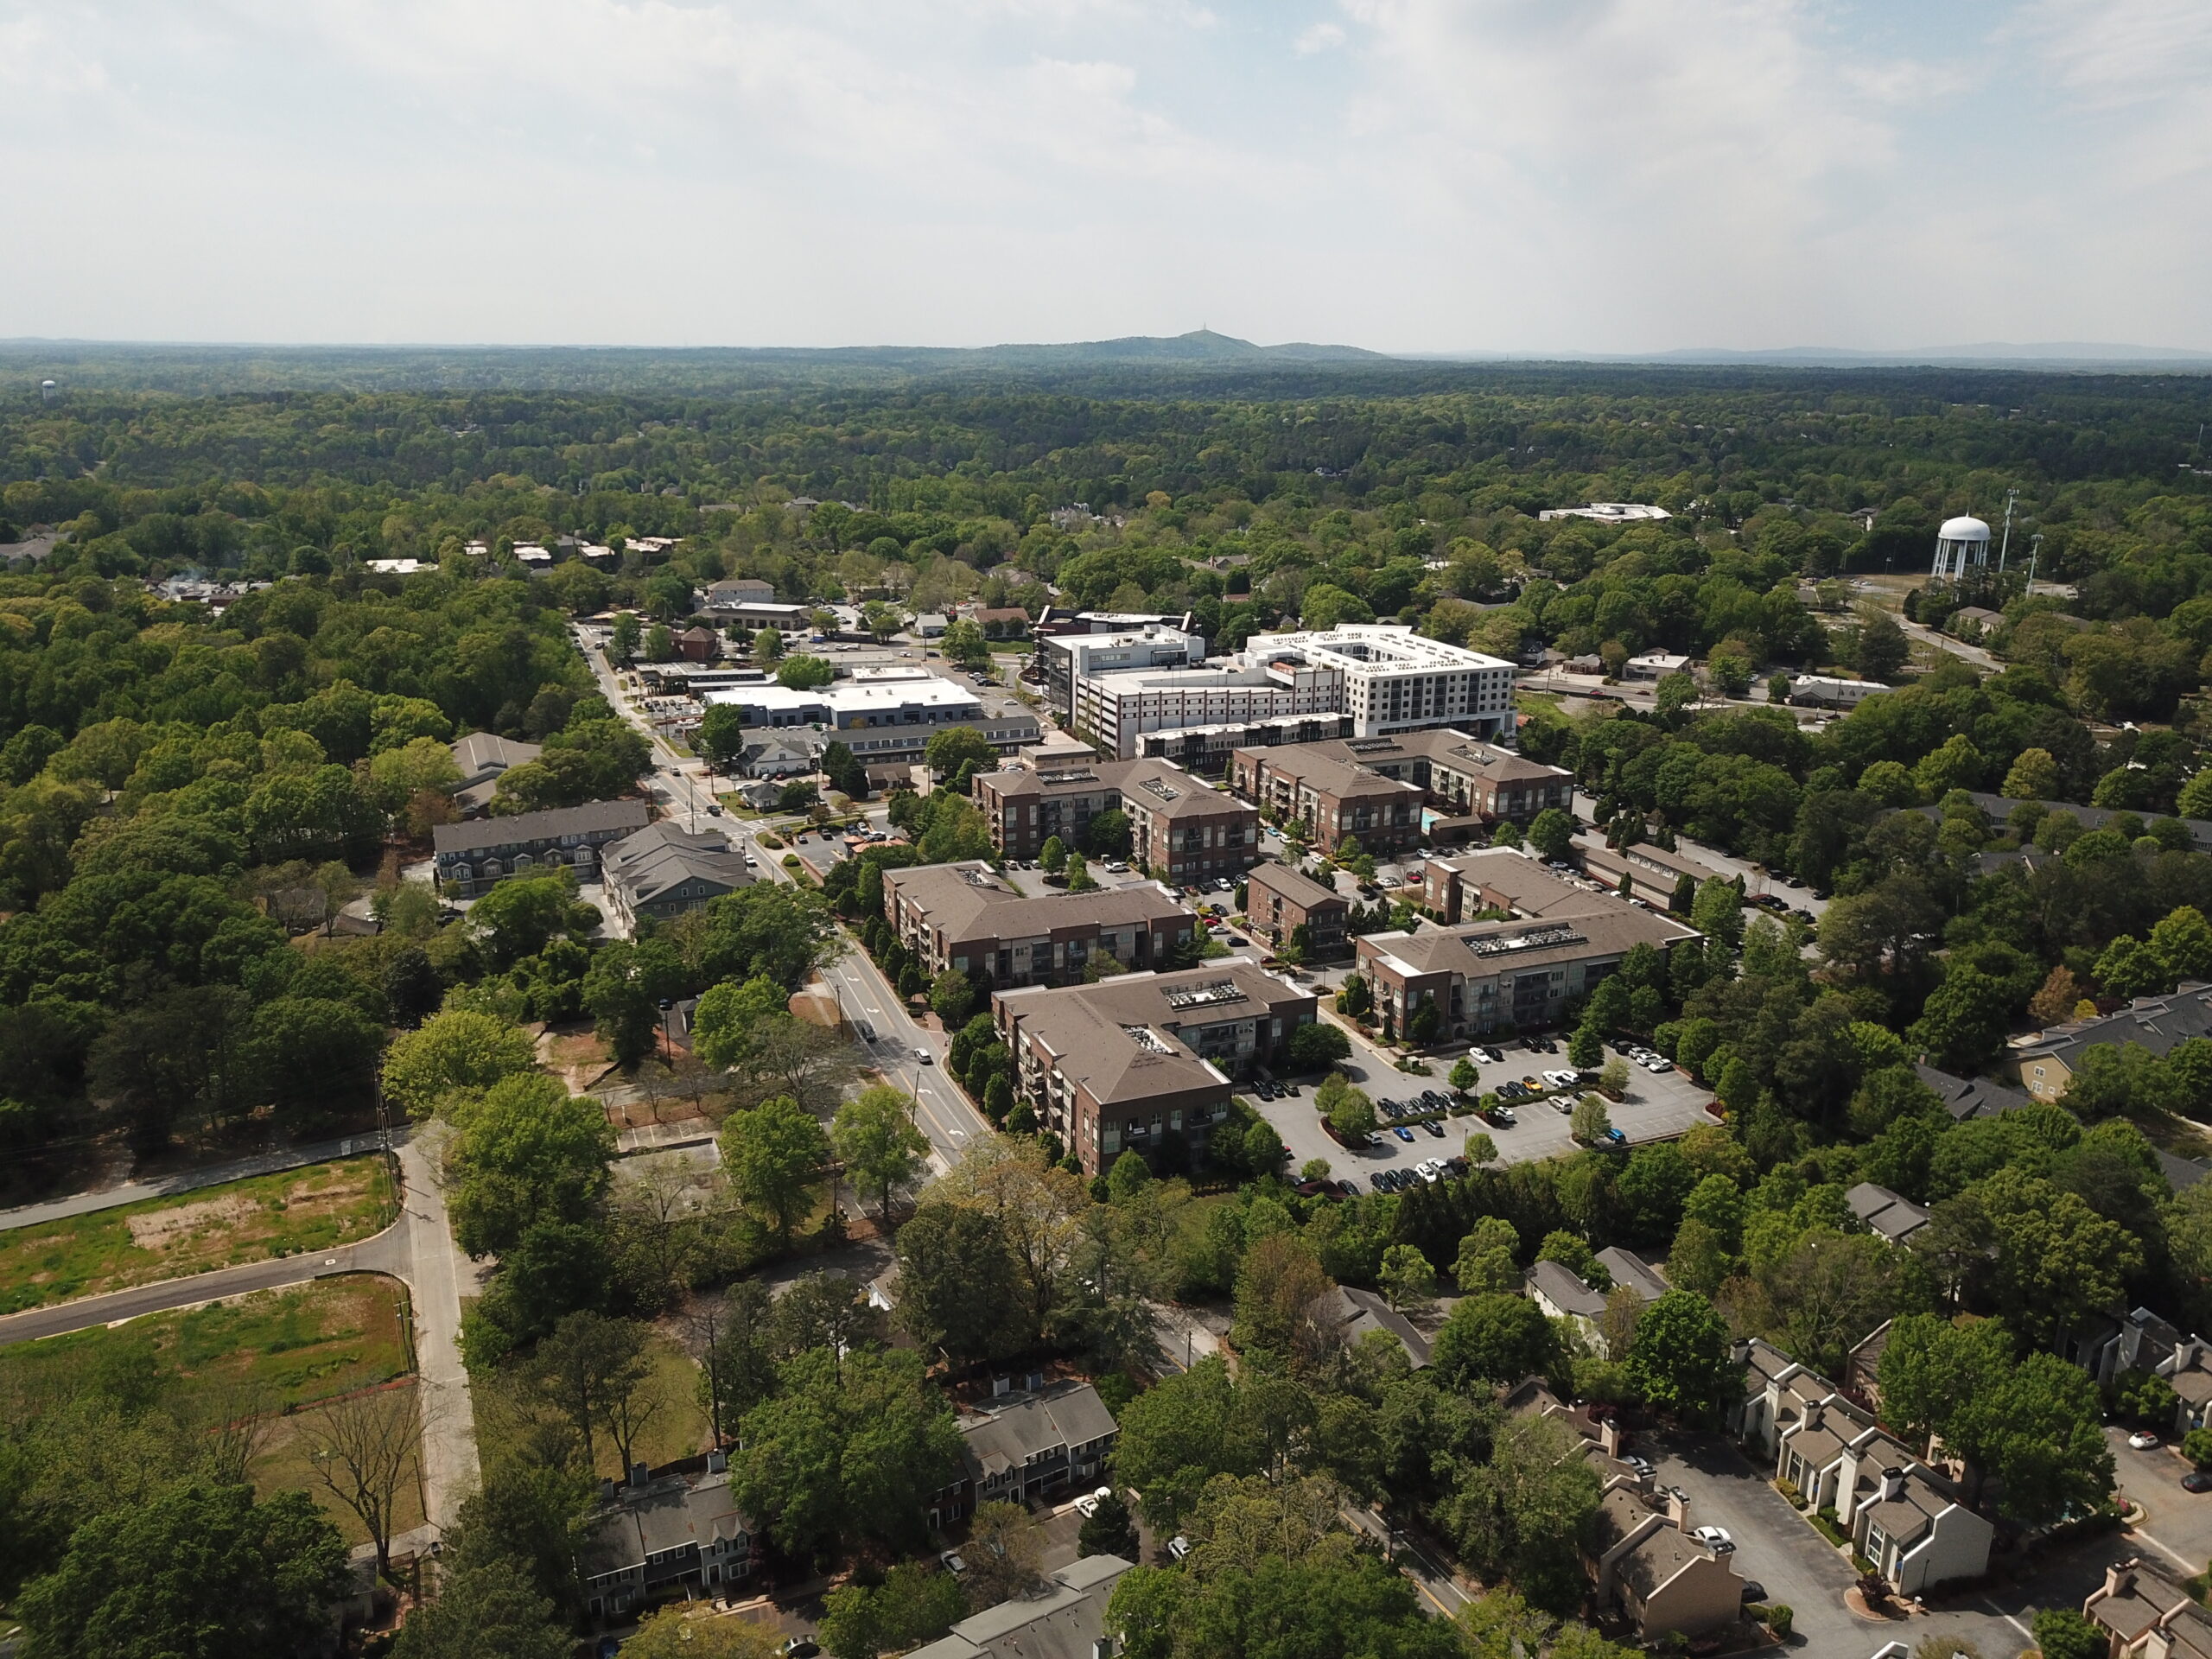


If you are trying to figure out what a house in Roswell actually costs right now, you have probably run into the same problem everyone else does: every website gives you a different number. Zillow says one thing, Redfin says another, Realtor.com says a third, and your neighbor swears the house down the street went for way more than any of them. The Roswell GA real estate market is not confusing because it is chaotic. It is confusing because four national data providers are measuring four slightly different things and publishing them all at once.
This report is our attempt to fix that. It is a full audit of Roswell home prices as of late August 2026: what the citywide numbers say, where they disagree and why, how the two halves of the city (30075 and 30076) have separated, what individual neighborhoods are actually closing at, what the monthly payment math looks like at today’s rates, and what Roswell property taxes add on top.
If you are still choosing between communities rather than pricing them, start with our best neighborhoods in Roswell breakdown, which covers amenities, HOA dues, and school zones in detail. If you are weighing Roswell against its neighbors, our cost of living comparison against Alpharetta, Sandy Springs and Marietta does that head to head. And if you are relocating from out of state, the complete Roswell relocation guide is the right starting point. This piece is the numbers.
Understanding the Roswell Housing Market in 2026
Three things define this market right now, and they pull in different directions.
Values are basically flat, not falling. Zillow’s Home Value Index for Roswell sits at $662,376, up 1.1 percent year over year, with data through July 31, 2026. That is the smoothed, whole-market measure, and it is the single most useful headline number because it is not distorted by which particular houses happened to close last month.
Transaction prices are noisy and can look alarming. Redfin’s three-month rolling median for the period ending June 2026 was $659,641, down 5.8 percent from the same period a year earlier. That looks like a crash next to Zillow’s plus 1.1 percent. It is not. Redfin is measuring the median of what sold, and when a couple of extra sub-$500,000 townhomes close in a small city, the median moves. Redfin’s own price per square foot for the same period was up 1.3 percent to $243, which is the tell: the per-foot value of Roswell housing held, while the mix of what traded got slightly cheaper.
Leverage has shifted toward buyers, but only partly. Roswell homes still go pending in about 28 days according to Zillow and sell at roughly 98.9 percent of list according to Redfin, both of which are seller-friendly readings. At the same time, 33.1 percent of Roswell listings took a price cut in the three months through June 2026, up 2.2 points year over year. Sellers are getting close to asking, but a third of them are getting there by lowering the ask first.
Put those together and you get the honest description: a high-priced, slow-appreciating, still-liquid market where correct pricing on day one is doing almost all the work.
At a Glance: Roswell Market Metrics
| Metric | Current reading | Source and date |
|---|---|---|
| Typical home value (ZHVI) | $662,376, up 1.1% YoY | Zillow, through 7/31/2026 |
| Median sale price | $667,367 | Zillow, 6/30/2026 |
| Median sale price (3-mo rolling) | $659,641, down 5.8% YoY | Redfin, 3 months ending 6/2026 |
| Median list price | $697,300 | Zillow, 7/31/2026 |
| Median price per square foot | $243, up 1.3% YoY | Redfin, 3 months ending 6/2026 |
| Active for-sale inventory | 500 | Zillow, 7/31/2026 |
| New listings (month) | 142 | Zillow, 7/31/2026 |
| Median days to pending | 28 | Zillow, 7/31/2026 |
| Median days on market | 30 | Redfin, 3 months ending 6/2026 |
| Sale-to-list ratio | 98.9%, down 0.45 pt YoY | Redfin, 3 months ending 6/2026 |
| Sales above list price | 26.6%, down 3.8 pt YoY | Redfin, 3 months ending 6/2026 |
| Listings with price drops | 33.1%, up 2.2 pt YoY | Redfin, 3 months ending 6/2026 |
| Redfin Compete Score | 66 of 100 (somewhat competitive) | Redfin, trailing 3 months |
| 30-year fixed mortgage rate | 6.66% | Freddie Mac PMMS, 8/27/2026 |
| Average rent (ZORI) | $1,733, up 1.2% YoY | Zillow, 7/31/2026 |
| City of Roswell millage rate | 4.949 mills (Tax Year 2025) | City of Roswell Finance |
All figures were pulled the week of August 25, 2026. Real estate data revises constantly, so refresh before you reshare.
Where Roswell Home Prices Actually Stand
The consensus band is roughly $660,000 to $700,000. Zillow’s typical value is $662,376 and its June median sale price is $667,367. Redfin’s rolling median is $659,641. Zillow’s July median list price is $697,300, and Movoto reported an August 2026 Roswell median list price of $699,000 at about $242 per square foot. List prices sit about $30,000 to $40,000 above sale prices, which is normal and consistent with a 98.9 percent sale-to-list ratio plus the drag of stale inventory that has not corrected yet.
Roswell is roughly 78 percent more expensive than the national typical home. Zillow’s national typical home value is $371,774. At $662,376, Roswell carries a substantial premium, which is what you would expect from a Fulton County city where median household income was $128,654 in 2024 and 71.9 percent of households own their home.
One reading is out of step and worth naming. Redfin’s page metadata for Roswell currently cites a July single-month average price of about $715,000, down 1.0 percent year over year, while the body of the same page reports the $659,641 three-month figure. Those are two different windows on the same page, not a contradiction, but if you see $715,000 quoted anywhere, understand that it is a single-month reading from a small sample and it will bounce.
Appreciation has flattened, not reversed. Roswell’s ZHVI is up 1.1 percent over twelve months. Nationally, Zillow’s index is up about 1.0 percent. Roswell is tracking the country almost exactly, which is a meaningful change from the 2020 through 2022 period when North Fulton badly outran the national average.
The Two Roswells: 30075 Versus 30076
This is the single most underrated fact about Roswell pricing, and most citywide articles skip it entirely. Roswell’s two primary residential ZIP codes are not one market.
30075 (west and north Roswell, including the Historic District). Zillow’s typical home value for 30075 is approximately $718,600 as of mid-2026, up about 1 percent year over year. This is the more expensive half: larger lots, the country-club communities on the west side, the Crabapple-adjacent northern edge, and the walkable historic core with its custom new builds. Redfin reported a March 2026 median sale price of $685,000 for 30075.
30076 (east Roswell, toward GA-400 and the river bend). Zillow’s typical home value for 30076 is $595,219, up just 0.4 percent year over year, with data through June 30, 2026. The median sale price was $572,745 in May 2026 and the median list price was $619,163 in June. Active inventory stood at 216 with 71 new listings in June, and homes went pending in a median of 25 days.
That is a gap of roughly $123,000 in typical home value between two ZIP codes in the same city. It is not a quality gap. It is a housing stock gap. 30076 is dominated by large 1970s and 1980s master-planned communities such as Martin’s Landing and Horseshoe Bend, plus a deep bench of townhomes and condos along the Holcomb Bridge corridor. 30075 skews toward newer construction, bigger lots, and a thinner supply of attached product.
For buyers, this is the most actionable line in the whole report: east Roswell is where a Roswell address is still obtainable under $600,000, and it moves faster (25 days to pending) than the city as a whole.
Zillow’s one-year forecast for 30076 is plus 0.5 percent, which is essentially a call for flat.
Inventory, Days on Market and Who Has Leverage
Supply is up but Roswell is still tighter than metro Atlanta. Zillow counted 500 active Roswell listings on July 31, 2026, with 142 new listings that month. Across metro Atlanta, homes.com reported 34,254 listings in July 2026 and months of supply at 5.5, up from 5.0 a year earlier, with a median 57 days on market. Roswell’s 28 to 30 day pace is roughly half the metro figure.
Roswell’s Redfin Compete Score is 66 out of 100. For comparison, Redfin scores the City of Atlanta at 44 and Alpharetta at 61 over the same trailing period. Roswell is currently the more competitive of the three, which surprises people who assume Alpharetta always wins.
Price cuts are the real story. A third of Roswell listings cut price during the three months ending June 2026. Sale-to-list at 98.9 percent means the average closed deal came in about 2 percent under the last asking price. Buyers who watch days on market and wait for the first reduction are being rewarded. Buyers chasing brand-new listings in the strongest pockets are not.
Hot homes are a different market. Redfin’s data shows Roswell’s fastest-moving listings still go pending in around 17 days at roughly list price. There is no single Roswell market. There is a well-priced, well-updated market that behaves like 2022, and an overpriced or dated market that sits for 90 days.
A note on months of supply: nobody publishes a clean, consistently sourced months-of-supply figure for the City of Roswell specifically. Earlier 2026 estimates put it near 3.9 months. We are not going to state a current Roswell number we cannot source. Use the metro 5.5 as the ceiling and assume Roswell runs meaningfully tighter.
Neighborhood-Level Prices in Roswell
This is where citywide medians stop being useful. Roswell’s neighborhoods range from $530,000 to well past $1.2 million, and several of the biggest ones are moving in opposite directions at the same time.
A caveat you should take seriously before reading the table. Neighborhood-level medians are computed on very small samples, sometimes fewer than a dozen sales in a quarter. A single large estate closing can swing a neighborhood median 15 percent. Year-over-year percentages at this level are close to noise. Treat the price levels as real and the percentage changes as directional at best.
| Neighborhood | Recent median | Pace | Source and window |
|---|---|---|---|
| Nesbit Lakes | $1,212,500 | 34 days | Homes.com, trailing 12 months |
| Sentinel on the River | ~$1,150,000 (single family) | Not published | Homes.com, recent |
| Brookfield West / Brookfield CC | $860,000 to $870,000 | 31 to 41 days | Homes.com, trailing 12 months |
| Willow Springs (Country Club of Roswell) | $825,000 | 14 days | Homes.com, June 2026 |
| Horseshoe Bend | $734,245, down 17.7% YoY | 23 days | Redfin, 3 months ending 6/2026 |
| Martin’s Landing (all types) | $603,276, up 16.2% YoY | 42 days | Redfin, 3 months ending 6/2026 |
| Martin’s Landing (single family) | ~$615,000 | 31 days | Homes.com, recent |
| Roswell Historic District | ~$615,000 | 42 days | Homes.com, January 2026 |
| Martin’s Landing (condos) | $530,000 | 31 days | Homes.com, trailing 12 months |
Nesbit Lakes
The most expensive established neighborhood in Roswell by trailing median, at $1,212,500 over the last twelve months, reportedly up 21 percent from the prior twelve. Homes sell in about 34 days. This is a large-home, high-income enclave: Homes.com puts the average household income at $204,696 and the college-graduate share at 84.2 percent, with only 5.6 percent of residents renting. Note that the 21 percent jump almost certainly reflects mix rather than true appreciation, given how few homes trade here annually.
Willow Springs and the Country Club of Roswell
Roughly 700 homes across about 650 acres around the member-owned Country Club of Roswell. The trailing median as of June 2026 was $825,000, with an average sale price of $807,403 and just 14 days on market, which is the fastest pace of any major Roswell neighborhood we tracked. Redfin scored Willow Springs 82 of 100 on competitiveness in a recent trailing window, its highest neighborhood reading in the city. Active supply is thin, typically five to fifteen listings.
What this means: Willow Springs is the tightest submarket in Roswell. If you want in, expect to move within days, not weeks.
Horseshoe Bend
The Redfin reading here is the one that will scare people, so it needs unpacking. Horseshoe Bend’s three-month median through June 2026 was $734,245, down 17.7 percent year over year, with price per square foot down 23.1 percent to $191. On its face that is a collapse. It is not.
Look at what actually closed. Recent Horseshoe Bend sales include $1,052,500 on Clubside Drive, $1,070,000 on Willowbrae Lane, $1,000,000 on Tapestry Trail, $930,000 on Lazy Laurel Chase, and $827,500 on Watercress Drive, several of them above list. Sales volume rose 48.9 percent year over year (27 homes in June versus 18). Median days on market is 23. Redfin still rates the neighborhood “very competitive” at 74 of 100, with 30.7 percent of homes selling above list.
A neighborhood where a third of homes sell over asking in 23 days is not down 17.7 percent. What happened is that a much larger and broader set of homes traded this year, pulling the median down while individual properties held or gained. The $191 per square foot figure is the clearest evidence: it fell 23 percent while median prices fell 17.7 percent, which is what a shift toward larger, less expensive-per-foot homes looks like.
Horseshoe Bend runs roughly 1,200 homes around the Horseshoe Bend Country Club, with an 18-hole course, a 14-court tennis complex, and three pools. HOA dues vary widely by section, roughly $17 to $600 per month.
Martin’s Landing
The mirror image of Horseshoe Bend, and just as misleading if you read one source. Redfin’s three-month median through June 2026 was $603,276, up 16.2 percent year over year. But price per square foot fell 2.0 percent to $196, and Homes.com’s trailing twelve-month condo median for Martin’s Landing was $530,000, down 10 percent. Both can be true. Redfin’s window caught a run of larger single-family sales.
The useful numbers: single-family Martin’s Landing generally runs into the $500,000s and $600,000s with a recent median near $600,000 to $615,000, while townhomes and condos start considerably lower, in the high $200,000s to $300,000s. Days on market ran 42 in Redfin’s window against 33 a year earlier, and 46.1 percent of listings took a price cut, the highest share of any Roswell neighborhood we reviewed.
Why it matters: Martin’s Landing is still the cheapest way into a Centennial High School zone with resort-grade amenities. It is roughly 1,964 homes on about 1,030 wooded acres, built from 1977 onward, centered on the 53-acre Martin Lake with a 2.4-mile loop path, three pools, 15 tennis courts, and the River Lodge. HOA dues commonly run around $286 per month. Redfin’s flood data flags Martin’s Landing as major flood risk, with about 5 percent of properties likely to be severely affected over 30 years, which is worth a specific look at any address near the lake or the river.
Brookfield West and Brookfield Country Club
West Roswell’s country-club market. Homes.com reports a trailing twelve-month median in the $860,000 to $870,000 range, up roughly 1 to 2 percent, with days on market between 31 and 41 depending on the slice. Redfin’s most recent published neighborhood snapshot rated it very competitive at 78 of 100. Lots are typically at least half an acre. Zoning is generally Mountain Park Elementary, Crabapple Middle, and Roswell High, though you must confirm the specific address with Fulton County Schools.
Inventory here is extremely thin. Recent Redfin counts show single-digit active listings, with new listings carrying a median list price above $1 million.
Roswell Historic District and Downtown
The most varied housing stock in the city and the hardest to summarize with one number. Homes.com pegged the January 2026 median at $615,000 with an average sale price of $662,791 and 42 days on market, while its trailing twelve-month median was $550,000. Redfin’s condo inventory in the district recently showed a median listing price around $300,000 across eight units, with homes-with-a-view listings at a $737,000 median.
That spread is the point. The Historic District contains $300,000 condos at Liberty Lofts and comparable buildings, townhome communities such as Hillandale, Providence, The Magnolias, and Founders Mill, and new custom single-family construction pushing past $1 million and occasionally past $2 million. It also has a much higher renter share than the rest of Roswell, close to half, which follows directly from all that attached inventory.
This is where Roswell’s entry-level product lives. If your budget is under $400,000 and you want a Roswell address, downtown condos and townhomes are the realistic path. Everything within walking distance of Canton Street carries a walkability premium that the rest of the city does not.
The Neighborhoods Where We Could Not Get Clean Data
Being straight about gaps matters more than filling them. Litchfield Hundred, Edenwilde, Saddle Creek, Barrington, Holcombs Crossing, and Sentinel on the River are all frequently searched Roswell neighborhoods, and none of them currently publish a reliable, recent median across the major platforms. Sales volume is simply too low. Realtor.com data from March 2026 showed median days on market of 46 in Barrington and 48 in Holcombs Crossing, both slower than the city average, and Homes.com lists Sentinel on the River single-family homes near $1,150,000. Beyond that, we are not going to invent numbers. Ask an agent to pull the actual closed comps for those specific subdivisions.
What a Roswell Home Actually Costs Per Month
Sticker price is not the payment. Here is the arithmetic at Roswell’s typical value of $662,376, using the Freddie Mac 30-year fixed average of 6.66 percent as of August 27, 2026.
With 20 percent down. Down payment of $132,475, loan amount of $529,901, principal and interest of about $3,405 per month.
With 10 percent down. Down payment of $66,238, loan amount of $596,138, principal and interest of about $3,831 per month, before mortgage insurance.
Add taxes and insurance. Using the City of Roswell’s own published methodology, a $662,376 home has an assessed value of $264,950 (Georgia assesses residential property at 40 percent of fair market value), which produces a City of Roswell tax of about $1,311 at the current 4.949 millage. The City states that its portion is approximately 16 percent of a Roswell resident’s total property tax bill, which implies a full bill in the neighborhood of $8,200 per year, or about $683 per month, before homestead exemptions. Add roughly $200 per month for homeowners insurance as a placeholder.
Total: roughly $4,290 per month at 20 percent down, before HOA dues. At a conventional 28 percent front-end ratio, that implies household income around $184,000. Roswell’s actual median household income was $128,654 in 2024.
That gap is the affordability story in one line, and it is why the entry-level condo and townhome segment downtown and in Martin’s Landing matters so much.
Rate sensitivity. On the same $529,901 loan, principal and interest runs $3,177 at 6.00 percent, $3,405 at 6.66 percent, and $3,525 at 7.00 percent. A full point of rate is worth about $350 per month, or roughly $70,000 of purchasing power. Rates sat at 6.66 percent on August 27, 2026, up from 6.65 percent the prior week and 6.56 percent a year earlier, and they have been running near a twelve-month high since a sharp move up in early July.
Roswell Property Taxes: What You Will Actually Pay
The structure. Georgia assesses residential property at 40 percent of fair market value. Roswell homeowners pay three separate millage rates: Fulton County, Fulton County Schools, and the City of Roswell. The City’s share is approximately 16 percent of the total bill, Fulton County Schools approximately 55 percent, and Fulton County approximately 29 percent.
The City rate. Roswell City Council adopted a millage rate of 4.949 for Tax Year 2025 on September 22, 2025, unchanged from 2024. That splits into 4.049 mills for Maintenance and Operations and 0.900 mills for Debt Service tied to the voter-approved bond program, which includes $86.2 million in issuances approved in May 2023. The City’s own worked example: a $575,000 fair market value home has a $230,000 assessed value and owes about $1,138.27 to the City, of which roughly $207 goes to the bond program.
Important timing note. As of publication, the City had not yet adopted a Tax Year 2026 millage rate. Roswell has historically set it in September. Check roswellgov.com before relying on the 4.949 figure for a 2026 estimate.
Exemptions matter here more than most places. The Roswell Floating Homestead Exemption capped 2019 taxable value at the lowest value from 2016, 2017, or 2018 plus 4.23 percent, and limits future annual increases to the rate of inflation or 3 percent, whichever is less. Fulton County also participates in HB 581, which caps homestead assessment growth at CPI from 2025 forward. Two identical houses on the same street can carry very different tax bills depending on how long the owner has held homestead status. If you are buying, do not assume the seller’s tax bill will be your tax bill.
Appeals. Fulton County’s assessment appeal deadline runs to August 1 each year. Homestead exemption applications are accepted January 1 through June 1.
The Rental Side of the Roswell Market
Roswell rents below the national average. Zillow’s Observed Rent Index for Roswell was $1,733 as of July 31, 2026, up 1.2 percent year over year and up 0.8 percent month over month, against a national average of $1,962. Roswell rents run about 12 percent below the national figure even though Roswell home values run about 78 percent above the national figure.
That is an unusual spread, and it has a clear implication: the rent-versus-buy math in Roswell currently favors renting on a pure cash-flow basis by a wide margin. A $1,733 rent against a roughly $4,290 all-in ownership cost at the median is not close. Buying in Roswell right now is a wealth-building and stability decision, not a monthly-savings decision.
The east side is cheaper. ZORI for 30076 was $1,624 as of June 30, 2026, and it was down 1.2 percent year over year, the only rent reading we found in Roswell that declined.
The new supply is at the top. Chandler Residences at Southern Post delivered 128 apartments and nine townhomes, with apartment layouts from 699 to 1,719 square feet starting around $2,300 per month. That is a 33 percent premium to the citywide average rent, and it sold out into a waiting list, which tells you there is real unmet demand for walkable rental product in Roswell.
Who Is Buying, and Where They Are Coming From
Redfin’s migration data for January through March 2026 shows 84 percent of Roswell homebuyers searched to stay within the Atlanta metro, with only 16 percent looking to leave. Nationally, about 2 percent of homebuyers searched into Roswell from outside metros.
Inbound. New York led all metros with a net inflow of 1,253, followed by Washington DC at 616, Los Angeles at 545, San Francisco at 324, and Chicago at 303.
Outbound. Chattanooga led with a net outflow of 377, then Macon at 282, Orlando at 233, Savannah at 200, and Jacksonville at 178.
Read carefully, that is a market being supported by high-cost-metro relocation on the way in and losing households to cheaper Southeast markets on the way out. It is a healthy pattern for prices as long as the inbound side holds.
Population is roughly flat to slightly down. The 2020 Census recorded 92,949 residents. Current estimates put Roswell near 91,300 to 92,600. Roswell is not growing its way into higher prices. Demand here comes from income and desirability, not from population expansion.
What the Development Pipeline Is Doing to Values
Downtown is the growth story. Southern Post, the 4.28-acre mixed-use project on Alpharetta Street two blocks from Canton Street, brought 137 residences, creative loft office, and street-level retail. Roswell Junction, a 12,000-square-foot food hall and entertainment venue with seven restaurant concepts at 340 South Atlanta Street, added another anchor just south of the historic square. The Chambray, a 125-room boutique hotel adjacent to Southern Post, broke ground on February 11, 2026, targeting a summer 2027 opening, financed with $14.76 million in third-party financing and no taxpayer liability according to the City.
Infrastructure is the other half. Big Creek Parkway, the Pine Grove Road corridor improvements, and the Woodstock Road Multi-Use Trail are all in progress. Big Creek Parkway Phase 2, a new bridge crossing GA-400 north of Holcomb Bridge linking Warsaw Road to Old Alabama Road, is coordinated with GDOT and the broader SR 400 express lanes work.
The near-term effect is friction, the long-term effect is value. Construction around Holcomb Bridge and Warsaw will make east Roswell commutes worse before they get better, which is a real consideration if you are buying in Martin’s Landing, Horseshoe Bend, or Willow Springs this year. Our Roswell traffic guide covers the current bottlenecks, and the Roswell Traffic Wizard shows live conditions if you want to test a commute before you make an offer.
Roswell Compared to Metro Atlanta
Context matters, because Roswell is not behaving like the metro.
Across the eleven-county FMLS region, the median sales price for a detached home was $475,000 in July 2026, up 2.2 percent from $465,000 in July 2025, with the average sales price up 6.4 percent to $610,246. Detached sales volume fell 6.6 percent, new listings fell 5.6 percent, and pending sales fell 16.2 percent from 3,624 to 3,036. Homes.com put the broader Atlanta metro median at $410,000 in July, up 2.5 percent, with 57 median days on market, 5.5 months of supply, and a 96.1 percent sale-to-list ratio.
Roswell is priced about 40 percent above the metro detached median, sells roughly twice as fast, and closes about 2.8 points closer to list. Those are the three numbers to hold onto.
The metro warning sign is pending sales. A 16.2 percent year-over-year drop in contracts is a leading indicator, and closings in September and October will reflect it. If that shows up in Roswell, it will show up first as longer days on market and a higher price-cut share, both of which are already drifting the wrong way.
Risks Worth Watching
Rates near a twelve-month high. The 30-year fixed moved sharply higher starting in early July 2026 from a plateau in late May, and it sits at 6.66 percent. Six months earlier it was near 6.01 percent. That move alone removed meaningful buying power from the Roswell price band.
Price cuts trending up. A third of Roswell listings are cutting price, and Martin’s Landing is at 46.1 percent. That is the metric to watch monthly.
Thin neighborhood data. Roswell’s premium neighborhoods trade so few homes per quarter that published medians are genuinely unreliable at that level. Anyone quoting you a precise Willow Springs or Nesbit Lakes appreciation rate is overstating what the data supports.
Assessment resets. HB 581 and Roswell’s floating homestead exemption protect long-term owners, not new buyers. Purchase-price-based reassessment can add thousands to a new owner’s annual cost relative to what the prior owner paid.
Flat population. Roswell is not adding residents. That caps the upside on volume-driven appreciation.
How to Read This Market as a Buyer or Seller
If you are buying, watch days on market before you watch price. In a market with a 98.9 percent sale-to-list ratio and 33 percent of listings cutting price, the negotiating leverage is in the listings that have already sat. New listings in Willow Springs, Horseshoe Bend, and Brookfield still move at close to list within three weeks. Anything past 45 days is a conversation.
If you are buying under $600,000, look east and look attached. 30076 has a typical value of $595,219 and a 25-day pending pace. Martin’s Landing condos and townhomes and downtown condos are the two genuine sub-$400,000 entries into a Roswell address.
If you are selling, price to the comps not the Zestimate. The gap between the $697,300 median list price and the $667,367 median sale price is roughly $30,000, and it is being paid for in days on market. Listings that price into the market on day one are still getting near-list offers in under three weeks.
Verify the school zone yourself. A Roswell mailing address spans multiple attendance zones, and parts of northern and western Roswell feed Milton High rather than Roswell or Centennial. Confirm the specific address with Fulton County Schools before you commit to anything.
Model the tax bill on your purchase price, not the seller’s. This is the single most common budgeting mistake North Fulton buyers make.
Final Thoughts on the Roswell Real Estate Market
Roswell in the fall of 2026 is an expensive market that has stopped getting more expensive quickly. Values are up about 1 percent for the year, which is to say flat in real terms. Homes still sell in under a month, which is to say demand is real. A third of sellers are cutting price, which is to say the days of naming a number and waiting are over.
The most useful thing a buyer can do here is stop treating Roswell as one market. A townhome in Martin’s Landing and a golf-course home in Willow Springs are separated by half a million dollars, twenty-eight days of market pace, and two different school feeder patterns. The citywide median of roughly $662,000 describes neither of them.
If you are working out whether Roswell is the right city in the first place, our pros and cons of living in Roswell is the honest version, and the best neighborhoods breakdown is the next step once you have decided. For everything else about living here, from trails and nature spots to where to eat on Canton Street, Roswell Pulse has you covered.
Roswell Pulse is a local information resource, not a licensed real estate brokerage or financial advisor. Verify all figures with a licensed professional before making a purchase or sale decision.